This function opens a static map of the zones
Arguments
- z
An `sf` object containing zones covering the region
- palette
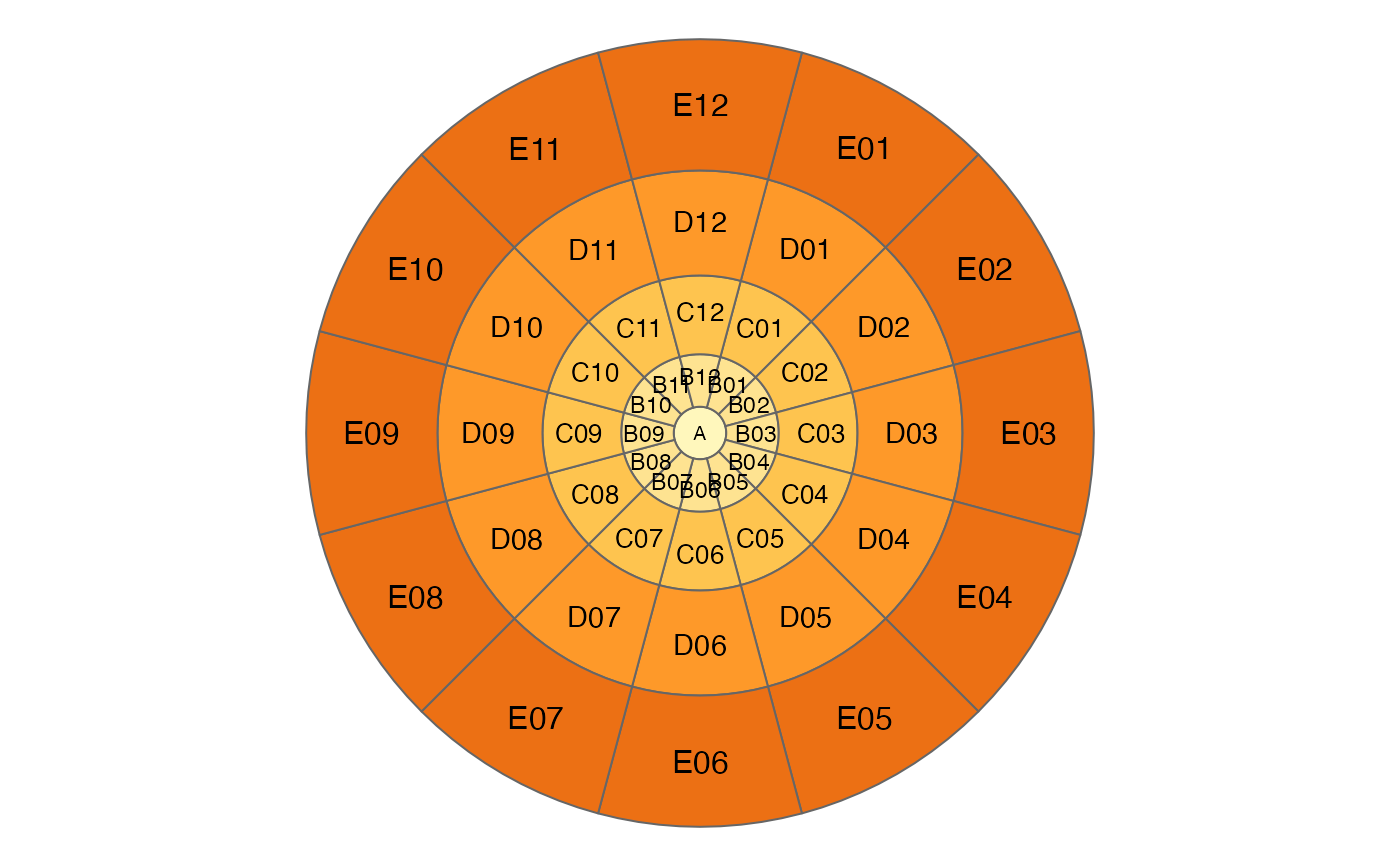
Palette type, one of
"hcl"(a palette based on the HCL color space),"rings"(a palette which colors the rings using the YlOrBr color brewer palette),"dartboard"(a palette which resembles a dartboard)- title
Plot title
- text_size
Vector of two numeric values that determine the relative text sizes. The first determines the smallest text size and the second one the largest text size. The largest text size is used for the outermost circle, and the smallest for the central circle in case there are 9 or more circles. If there are less circles, the relative text size is larger (see source code for exact method)
- zone_label_thres
This number determines in which zones labels are printed, namely each zone for which the relative area size is larger than `zone_label_thres`.
Value
A static plot created using R's base `graphics` package